Rainfall rate tests
To test Oww's measurement of rainfall rate (which uses the
time-between-increments technique) I ran water into the gauge from a coffee
filter funnel, at various rates. Results were collected with TherMon. OK, I
should really have done nicer plots from a log file, but I didn't yet get
around to adding the rainfall rate to the log output.
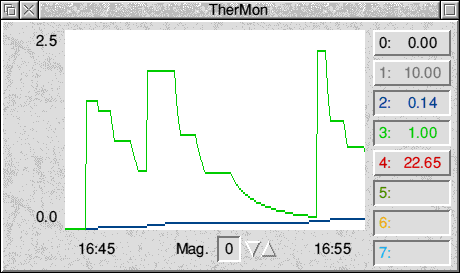
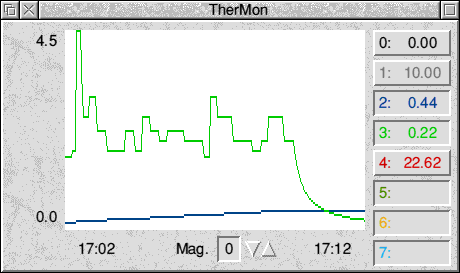
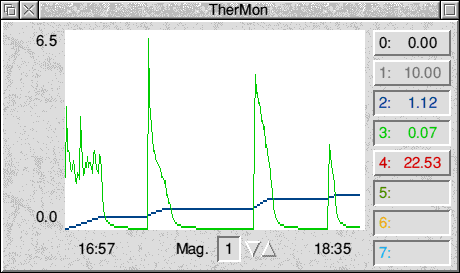
A common feature is the tailing off by 1/t. This is down to the nature
of the calculation. But the real rate also tailed off, as the water ran out of
the funnel. On the late shoulder of each ‘pulse’ the two match
nicely, such that when the later bucket tips come there is no ‘join’
in the plot.
An important feature, in my opinion, is that the rate value responds
fully by the second bucket tip.
y scale is rainfall rate (inches / hour) –
green line
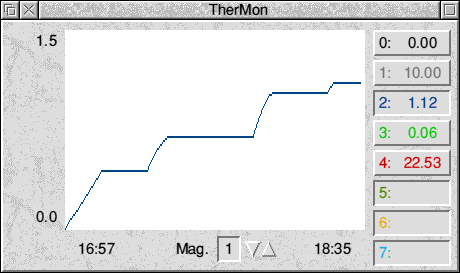
gauge reading (inches) – blue line |

10 minutes. Filter filled, re-filled, allowed to empty, and then
refilled. |

10 minutes. Filter filled almost to top, then topped up to around
50%, then left to drain. |

10-reading averages - 38 minutes. Starts with data from the above
plot. Then 3 more cycles. |

Gauge readings to go with the above plot. 0 – 1.5
inches |
Dr. Simon J. Melhuish. 6th
December, 2000.


